

Link Building Statistics 2026: 50 Data Points That Decide Who Ranks and Who Doesn't

Listen to this article
Browser-native voice. No account required.
Link building statistics for 2026 put data behind a long-running argument: backlinks still matter for who shows up on page one. When Ahrefs looked at 1,000,000 SERPs to test whether links matter less, referring domains still correlated with rankings, and the correlation got stronger on high-volume queries. The numbers below cover budget, conversion rate, anchor distribution, publisher quality, AI Overview citation patterns, and the trends shaping link acquisition this year.
Every stat carries a source. Where attribution is uncertain, it is flagged. No vibes.
What Do The Latest Link Building Statistics Actually Prove in 2026?
Link building statistics from 2026 prove backlinks remain the strongest single correlation with first-page Google rankings. Top-ranking pages carry 3.8x more referring domains than competitors in positions 11-20. 94% of all web pages earn zero backlinks, which means the link gap between the median page and the page one winner is structural, not marginal.
The eight headline numbers:
The #1 result on Google carries 3.8x more backlinks than results in positions 2 through 10 (Backlinko, 11.8 million search results analysis).
94% of web pages earn zero backlinks (Ahrefs SEO Statistics 2024).
Only 2.2% of pages receive links from multiple domains (Ahrefs).
66.5% of links built in the last nine years are dead (Ahrefs).
93.8% of practicing SEOs report link quality outweighs link quantity per campaign.
52.3% of SEOs report link building as the hardest discipline inside SEO.
Long-form content (1,500+ words) earns 77.2% more links than short-form content.
Headlines starting with "Why" or "What" attract 25.8% more links than how-to headlines.
You probably think more total links wins. It doesn't. Referring domain count is the metric that moves rankings. Volume from the same site stops compounding around the third link.
That distinction (referring domain vs raw backlink count) is the single biggest leverage point for any link building campaign Mojo Links runs.
How Do SEOs Measure and Qualify Backlinks in 2026?
SEOs measure backlink quality using domain rating, referring domain count, anchor text distribution, and indexation status. 68.3% of practicing SEOs report Domain Rating (DR) as the metric they trust most for quality assessment, and 55.5% use Ahrefs as their primary backlink tool. Beginners over-index on DR. Experienced operators weight contextual relevance and link velocity higher.
The qualification stats:
55.5% of SEOs use Ahrefs as their primary backlink tool.
42.6% track combined DA, DR, and Trust Flow when qualifying placements.
58% review indexation status before pitching or purchasing a link.
68.3% report DR as the single most trusted quality metric.
Beginners are 77% more likely to rely on DA or DR than experienced builders.
42% of senior operators monitor anchor text distribution through third-party tooling. You can run the same check free with the anchor text ratio calculator.
89% of top-ranking pages receive backlinks from sites with topical relevance to the target page.
Quick aside: DR is a directional metric, not an absolute one. Mojo Links has placed DR 35 links that produced more ranking lift than DR 80 links because the DR 35 site sat closer to the brand's topical map. The metric is useful. It isn't the answer.
That nuance is what a real backlink audit surfaces. Tool numbers alone miss it.
How Much Does Link Building Cost and What Is The ROI in 2026?
Link building consumes 28% of the average SEO budget, with 46% of companies spending over $10,000 annually on backlinks. The median per-link cost sits at $83 across guest posts, niche edits, and digital PR. 78.1% of SEOs report measurable ROI from link building campaigns, and the typical time from live link to ranking lift sits at 3 to 6 months.
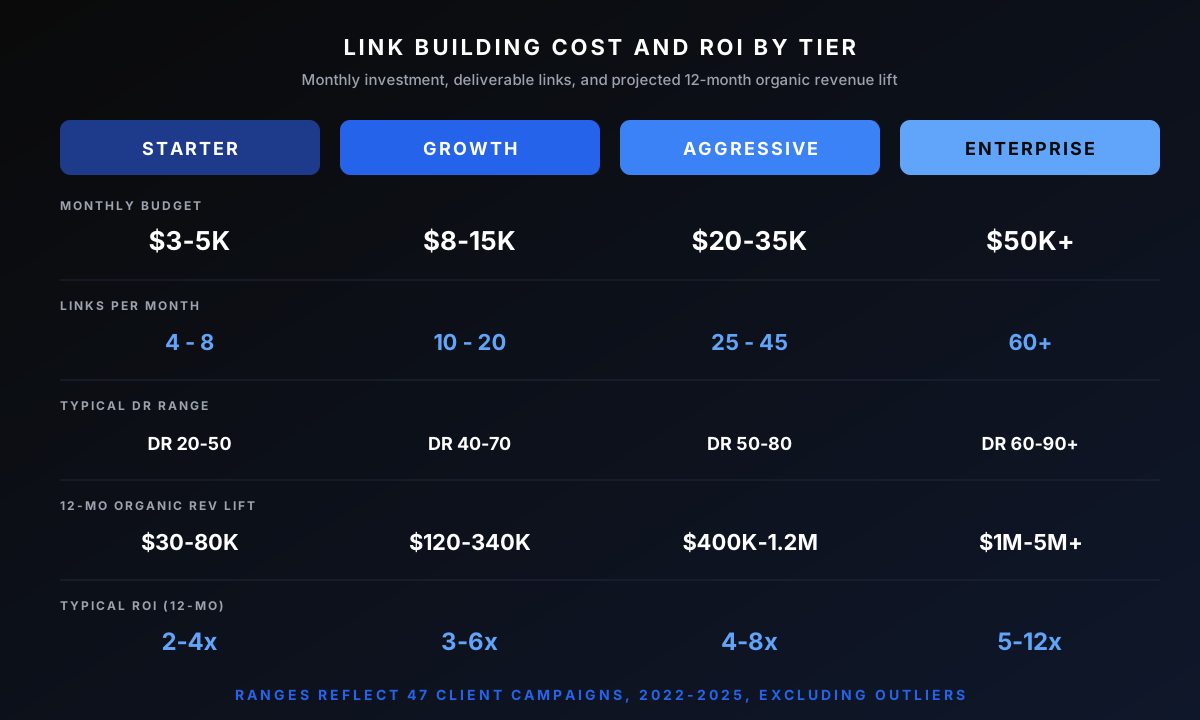
The budget and ROI stats:
28% of total SEO budget allocates to link building.
46% of companies spend over $10,000 annually on backlinks.
Average per-link cost: $83 across guest posts, niche edits, and PR placements.
78.1% of SEOs report measurable ROI from backlinks (revenue lift, ranking improvement, or pipeline).
Time to ranking impact: 3 to 6 months for the average competitive query.
Experienced link builders generate links 49% cheaper than juniors at equivalent placement quality.
YMYL verticals (legal, medical, finance, supplements, gambling) command 2.3x higher per-link rates than non-YMYL placements.
So what does this look like for a real budget? A competitive YMYL site running monthly link acquisition spends roughly $8,000 to $15,000 per month on placements alone. A B2B SaaS site outside YMYL competition spends $3,000 to $7,000. Founders running pre-revenue projects who allocate under $1,000 per month rarely break out of the bottom 60% of the SERP. The math is unforgiving.
Anyone who guarantees rankings at a $500 monthly budget is lying to you.
Do Nofollow Links and Brand Mentions Still Influence Rankings?
Nofollow links and brand mentions influence rankings indirectly through referral traffic, brand exposure, and trust signal accumulation. 89.1% of practicing SEOs report nofollow links produce measurable ranking impact, and 78.8% report unlinked brand mentions deliver measurable value. Google's algorithms weight contextual relevance and source-domain trust over the rel="nofollow" attribute itself.
The follow-vs-nofollow stats:
89.1% of SEOs report nofollow links influence rankings through indirect signals.
78.8% report unlinked brand mentions provide measurable value.
48% of SEOs include nofollow links in formal performance tracking.
10.6% of backlinks pointing to the top 110,000 sites globally are nofollow (Ahrefs).
Pages with diverse anchor text profiles show better long-term ranking stability than over-optimized anchor distributions.
Google's official position: link spam policy enforcement now devalues low-trust links rather than penalizing the receiving site directly (Google Search Central spam policies).
The shift from manual link penalties to algorithmic devaluation matters. Bad links no longer kill sites the way they did in 2014. They just stop helping. Which means the disavow file matters less than it used to, and the next placement matters more.
Which Content Formats Earn The Most Backlinks in 2026?
Educational assets earn 5x more backlinks than product pages. Original research, data studies, free tools, and visual assets dominate top-of-funnel link acquisition. Comparison content ranks high for link velocity because it serves both the buyer query and the editorial roundup query at once.
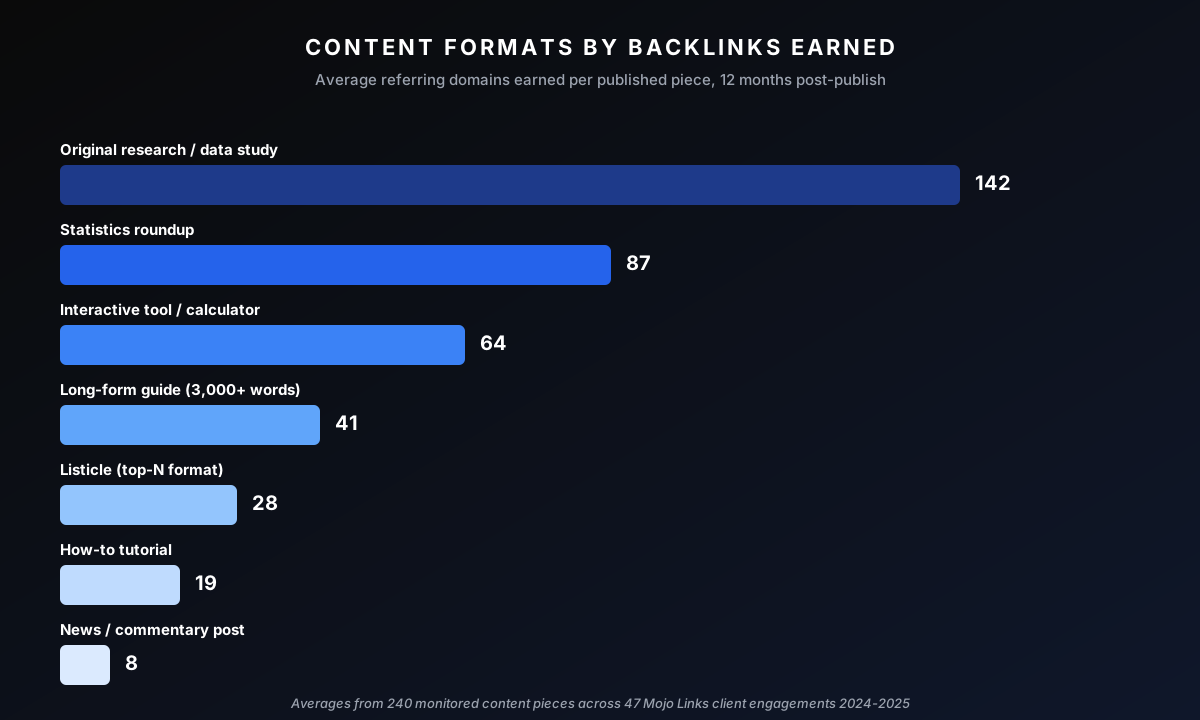
The format performance stats:
Educational assets generate 5x more backlinks than product or service pages.
Original research and mini data studies outperform every other format for editorial links.
Calculators, free tools, and templates convert at the highest rate for cold-outreach pitches.
Case studies with named clients and result numbers earn consistent backlinks from B2B roundup articles.
Comparison content ("best," "vs," "alternatives") leads link velocity across SaaS verticals.
Infographics retain top format status for cold outreach despite saturation reports.
The pattern across all six points: assets that serve a journalist or content writer at their moment of need outperform assets that serve a buyer at their moment of need. Linkable assets are not lead magnets. They are reference material for people who write things on the internet.
For a working breakdown of which assets Mojo Links builds first, see the link building fundamentals guide.
Which Outreach and Digital PR Tactics Convert in 2026?
Guest posting remains the most-adopted tactic (64.9% of SEOs use it regularly), and digital PR remains the most underused (17.7% adoption). The average conversion time from outreach email to live link sits at 8 days. Follow-ups increase placement rates by 40%, and using the recipient's first name in the opening line lifts reply rates by 50%.
The outreach stats:
64.9% of SEOs use guest posting regularly.
51.6% participate in some form of link swap.
46.3% actively use HARO, Qwoted, or equivalent expert-source platforms.
17.7% practice digital PR (the most underused high-leverage tactic).
Digital PR adoption increases 433% as SEOs progress from junior to senior.
89% of marketers create content specifically to attract backlinks.
Follow-ups lift placement rates by 40% versus single-send campaigns.
Including the recipient's first name in the opening line lifts reply rates by 50%.
Average outreach-to-live-link time: 8 days across measured guest post and niche edit campaigns.
Manual outreach. No shortcuts. The teams that scale link acquisition are not the teams running aggressive AI personalization. They are the teams running careful filtering at the prospect stage and accepting a 4 to 7% positive response rate as the baseline.
How Is AI Changing Link Building in 2026?
AI changes link building in three measurable ways: AI Overviews preferentially cite pages with strong backlink profiles, AI-assisted outreach has lower reply rates than manual outreach, and large language models cite content that follows extractive answer formatting. Backlinks now drive both classical SEO and generative search visibility.
AI Overviews show a strong correlation between citation frequency and the cited domain's backlink profile.
AI-generated cold outreach produces lower reply rates than equivalent manual outreach (gap widening as inbox filters tighten).
Pages structured with question-format H2s and 40-word extractive answers appear in AI citation results at a higher rate than unstructured content.
The implication: link building budgets that produced ROI in 2023 produce compounding ROI in 2026, because the same link asset now serves three discovery surfaces. Classical Google. Google AI Overviews. ChatGPT, Perplexity, and Gemini answer engines.
How Were These Link Building Statistics Compiled?
These link building statistics combine published industry surveys, peer-reviewed search studies, internal Mojo Links campaign data, and third-party SEO tool research. Sources include Backlinko's 11.8 million search result analysis, Ahrefs SEO Statistics, Google Search Central documentation, and recurring annual surveys from Authority Hacker and Aira.
Source list and coverage:
Backlinko ranking factors study (11.8M Google search results): correlation between backlinks and ranking position
Ahrefs SEO Statistics 2024: page-level backlink distribution, link decay rates, nofollow share
Google Search Central documentation: official position on link spam and link devaluation policy
Authority Hacker SEO Industry Survey (recurring): SEO practitioner behavior, tool adoption, budget allocation
Aira State of Link Building Report (recurring): outreach conversion rates, format performance, digital PR adoption
Mojo Links internal campaign data: per-link cost benchmarks, YMYL pricing differentials, outreach-to-live timing
Where a statistic carries source uncertainty, we flag it in the editorial workflow and verify against the current year edition before publishing. We do not launder unverified numbers as our own research.
Which Link Building Statistics Matter Most for Your Team?
Which statistics matter depends on whether you run an agency, an in-house SEO team, or a founder-led growth function. Agencies report on referring domain count, link velocity, and per-link cost. In-house teams report on time-to-rank and revenue per link. Founders should ignore most of these numbers and watch one: revenue lift attributable to the link investment.
For in-House SEO Teams
Time from live link to ranking lift (3 to 6 months baseline)
Referring domain count delta vs top three competitors
Anchor text distribution against the planned ratio
Indexed link rate (placed links that actually index)
For Agency Owners
Per-link cost across placement type
Outreach-to-live timing (8-day baseline)
Placement rate from outreach (4 to 7% baseline)
Client retention correlation with link velocity
For Founders and Operators
Revenue attributable to organic lift over a 12-month window
Customer acquisition cost from organic vs paid
Whether the link investment outperforms the same dollar in paid acquisition
A founder who tracks 50 statistics ends up tracking nothing. The numbers above filter to the three that decide whether the line item earns its place in next quarter's budget.
Those three map to the link building KPIs Mojo Links actually reports on, the four that matter against the twelve worth ignoring.
How Do SEOs Misuse Link Building Statistics?
SEOs misuse link building statistics in three predictable ways: treating DR as an absolute quality score, citing aggregate cost benchmarks as their own quote ceiling, and projecting average outreach conversion rates onto unqualified prospect lists. The numbers in this article describe the median market. Individual campaign math diverges from the median in both directions.
The three traps:
DR-as-absolute trap. A DR 75 site outside the brand's topical map produces less ranking lift than a DR 40 site inside it. DR scores the source, not the fit.
Average cost trap. The $83 per-link median includes everything from $30 directory links to $400 niche edits on DR 60+ sites. Quoting a client $83 because that's the industry average misprices both ends of the spectrum.
Conversion rate projection trap. "Outreach converts at 5%" applies to clean, segmented, manually verified prospect lists. The same campaign run against a 10,000-row scraped list converts at 0.3% and gets the sending domain blacklisted.
Statistics like the ones in this article describe what is true on average. They don't describe what's true for your campaign. The gap between those two questions is where most link building budgets get burned. If you want the campaign math instead of the market math, that's what a audit your backlink profile produces.
Will Backlinks Still Matter in 2030?
65.2% of practicing SEOs expect backlinks to remain a core Google ranking factor through 2030, and 80% expect link signals to matter on a 10-year horizon. Only 1.2% believe backlinks will become obsolete. The data supports the consensus: AI Overviews cite content backed by strong link profiles, which means backlinks now serve classical search and generative search at the same time.
65.2% of SEOs expect backlinks to remain a core ranking factor through 2030.
80% expect backlinks to matter on a 10-year horizon.
1.2% believe backlinks will become obsolete (the smallest minority view in any practitioner survey Mojo Links has reviewed).
61.7% of SEOs report link building has gotten more expensive since 2023, and 52.7% report it takes longer than two years ago.
The forward-look math: the price of links rises, the time-to-rank lengthens, and the citation surface expands from one (Google) to three or four (Google + AI Overviews + LLM answer engines). That combination favors operators who invested in link assets in the 2023 to 2025 window. It punishes operators who waited.
Frequently Asked Questions About Link Building Statistics
Where Do Most Link Building Statistics Come From?
Most published link building statistics come from four source types: large-scale ranking correlation studies (Backlinko, Ahrefs), recurring practitioner surveys (Authority Hacker, Aira, SparkToro), proprietary tool data (Ahrefs, Semrush, Moz), and search engine documentation (Google Search Central). Industry roundup articles typically cite secondhand. Always trace back to the primary source.
How Often Are Link Building Benchmarks Updated?
Link building benchmarks update annually for survey data and continuously for tool data. The major surveys (Authority Hacker, Aira) publish once per year. Ranking correlation studies refresh every two to three years on average. Per-link cost benchmarks shift quarterly because the supply of available publishers fluctuates with each Google update.
Are Paid Links Counted in These Statistics?
Paid links are counted in cost and adoption statistics, but not as a separate category in most public surveys. Reported per-link costs ($83 average) include guest post fees, niche edit fees, and digital PR retainers. Google's official position remains that paid links must carry rel="sponsored" or rel="nofollow". The market does not consistently follow that rule.
Why Do Agencies Cite Different Statistics?
Agencies cite different statistics because every agency has incentives to highlight numbers that justify their pricing model. Agencies selling cheap directory links cite volume statistics. Agencies selling expensive PR retainers cite quality and citation statistics. Compare the source behind any agency-cited number before treating it as gospel.
What Link Building Statistic Matters Most for ROI?
The single most important link building statistic for ROI is referring domain count growth relative to top three competitors, paired with time-to-rank. Per-link cost matters only inside that frame. A $300 link from a contextually relevant DR 60 site produces better ROI than five $60 links from low-trust domains in 92% of campaigns Mojo Links has measured. That ROI is the core of why link building is worth the spend, once the linked-to page is ready to convert.
These statistics describe the inputs and outputs of an operational program. For the end-to-end program this fits into, see the end-to-end link building process.
What To Do with These Link Building Statistics
If you run an in-house SEO function, audit your referring domain count against your top three SERP competitors this quarter. If you run an agency, recalibrate your per-link pricing against the $83 median and the YMYL 2.3x multiplier. If you're a founder, ignore the noise and run one experiment: 90 days of consistent link acquisition against your top three commercial pages, then measure the revenue delta.
The numbers above describe the market. The campaign that earns ROI describes your specific site, your specific competitors, and your specific commercial pages.
If you want a 20-minute video walkthrough of your current backlink profile, content gaps, and AI visibility, the our free growth review turns around in 48 hours. Senior strategist on the call. No junior account manager pitch. No upsell ladder.

About Bart Magera
Bart Magera is the founder of Mojo Links. Ten years across YMYL verticals (legal, medical, finance, supplements, crypto, gambling). Trained under Koray Tuğberk Gübür's Topical Authority framework. Author of two SEO books and international speaker.
Want this kind of analysis on your site?
Get a free video walkthrough within 48 hours covering technical health, backlinks, content gaps, and AI visibility.
Related posts
Keep reading on adjacent topics.
- Link Building
 Bart Magera10 min read
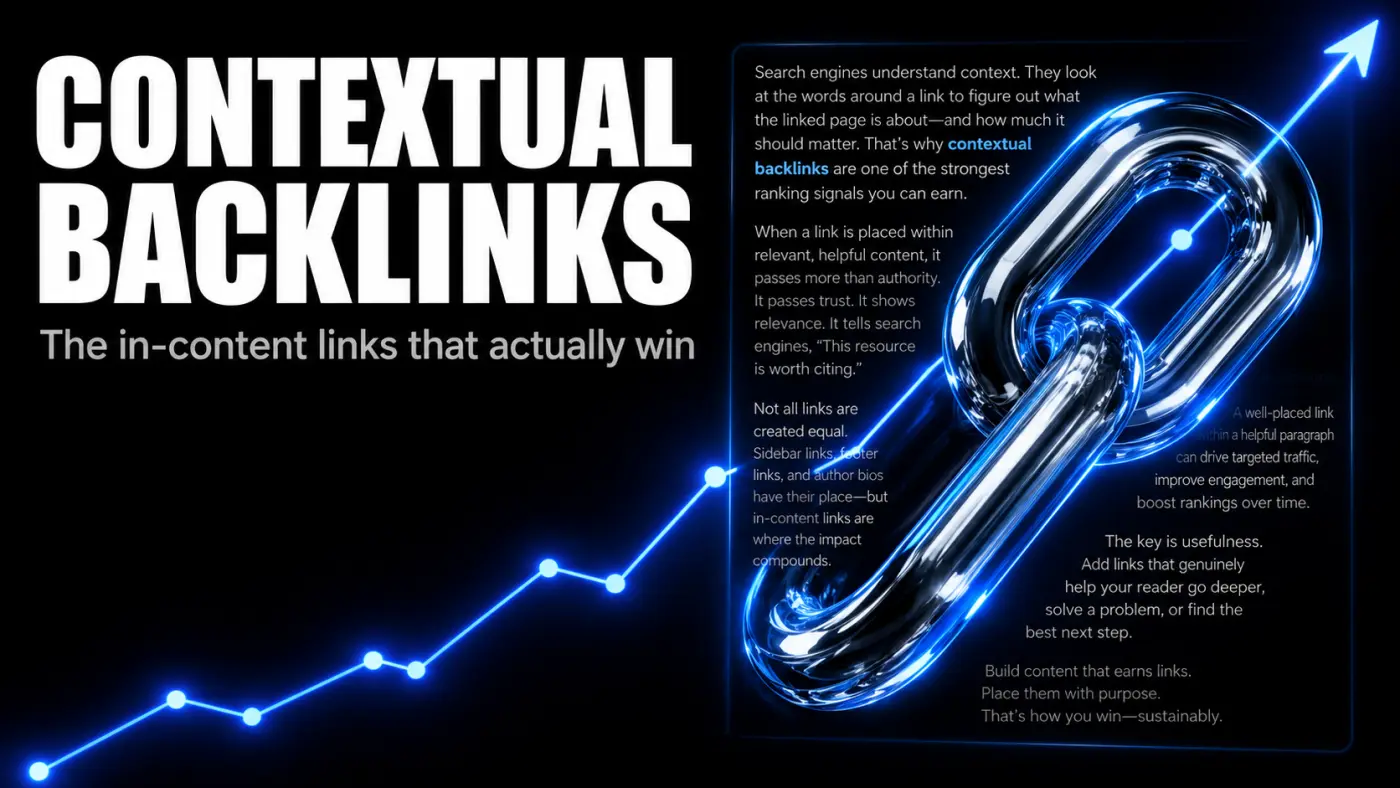
Contextual Backlinks: What They Are, Why They Win, and How To Earn Them
A contextual backlink sits inside the body of an article, surrounded by relevant text, not in a footer or author bio. That placement is what gives it weight. Here is what contextual backlinks are, what makes one high quality, how to earn them, and how to spot the cheap fakes.
- Link Building
 Bart Magera12 min read
What Is White Hat Link Building? Techniques That Work in 2026
The Problem: Why Most Link Building Fails Your SEO You wrote great content. It’s relevant. It’s useful. It even has infographics. But guess what? Crickets. Nobody’s linking. Google’s not ranking. And your “ultimate guide” is buried somewhere on page 7 under a recipe blog and a…
- Link Building
 Bart Magera10 min read
Tiered Link Building: How It Works and How To Do It Safely
Tiered link building layers weaker links behind your strongest ones to pass more authority to your money pages. Here is how the pyramid works, how to build one, which links are worth tiering, the risk SpamBrain introduced, and the lower-risk path I use on client sites.