

Link Building KPIs: The Four That Matter and The Twelve To Ignore
Listen to this article
Browser-native voice. No account required.
Most link-building dashboards have twelve metrics. None of them connect to revenue. The agency added them because the tool dashboard offered them, and the client never pushed back because "more numbers" looks like rigour. This post is the four KPIs to report every month, the twelve to refuse to include, and why the refusal matters more than the inclusion.
Which Link-Building KPIs Actually Matter?
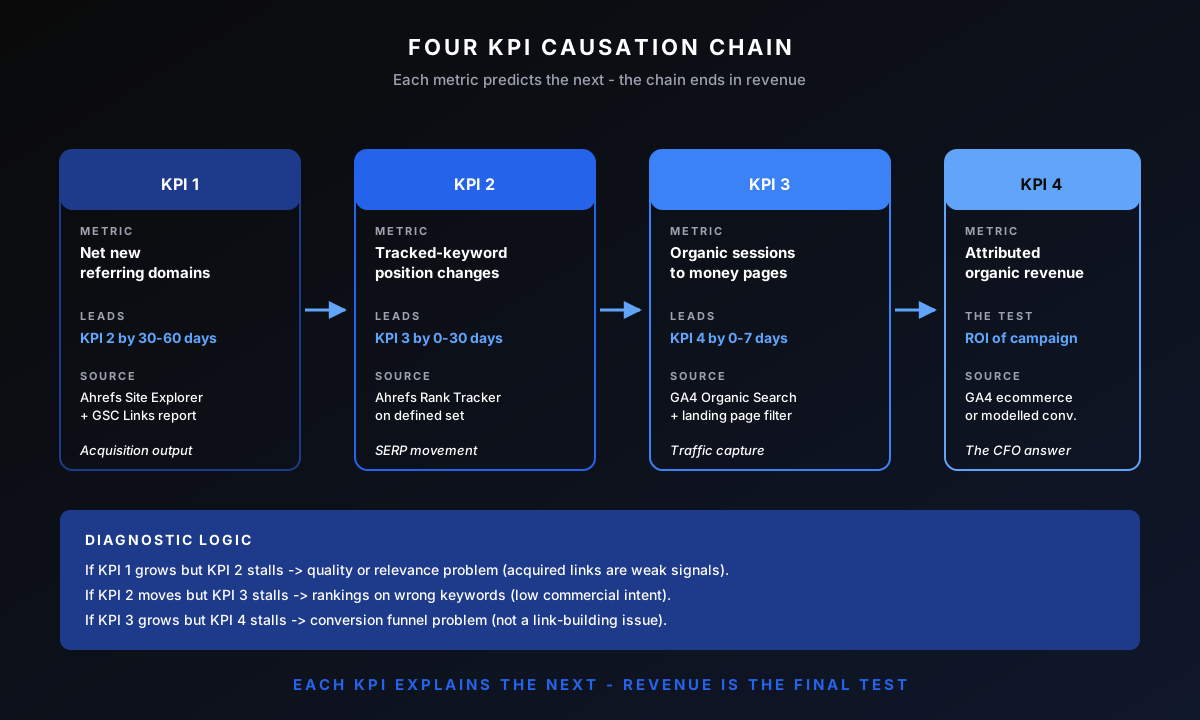
Four KPIs sit on every monthly client report. Net new referring domains. Tracked-keyword position changes. Organic sessions to money pages. Attributed organic revenue. Each metric explains the next, and the chain ends in the only number that matters to the CFO.
The four-KPI framework ties into the broader Link Building Operations Guide. Referring domains get the heaviest weighting because an Ahrefs study on links from pages with traffic found URL Rating and referring-domain count correlate with rankings more strongly than the linking page's own traffic. Every other metric is internal diagnostic data, not client-facing performance reporting.
KPI 1: Net New Referring Domains
What to measure: unique domains that pointed at least one new dofollow link at the site in the reporting period, minus domains lost (links removed, sites de-indexed). Why it matters: this is the leading indicator. Ranking changes lag referring domain growth by 30 to 60 days. If RD growth stalls, ranking growth will stall a month or two later. More industry benchmarks of that kind live in the link building statistics roundup, fifty data points deep.
How to capture it: Ahrefs Site Explorer "Referring domains" report with date filter, cross-checked against GSC "Links" report. Exclude paid-link disclosures and nofollow-only domains from the count. Realistic monthly RD growth depends on tier: 4-8 at Starter, 10-20 at Growth, 25-45 at Aggressive, 60+ at Enterprise. Both tools belong to the wider stack documented in the link building tools guide.
KPI 2: Tracked-Keyword Position Changes
What to measure: position movement on a defined keyword set (typically 30-150 commercial terms agreed at engagement start), captured weekly via Ahrefs Rank Tracker. Why it matters: positions are the next link in the causation chain. A campaign producing referring domain growth but no position changes has a quality or relevance problem covered in the toxic backlinks guide.
Report on three sub-metrics within position changes. First, average position across the tracked set. Second, count of keywords entering top 10. Third, count of keywords ranking in top 3. The third sub-metric is where most revenue actually concentrates.
KPI 3: Organic Sessions To Money Pages
What to measure: GA4 sessions from organic search landing on commercial pages (defined as pages with revenue intent, typically /pricing, /services/*, product pages, comparison pages). Why it matters: ranking positions translate into traffic only if the page sits on commercial-intent terms. A keyword position change on a low-intent informational query produces no revenue lift.
How to capture it: GA4 with the "Landing page" dimension filtered to the defined money-page URL set, "Default channel grouping" filtered to Organic Search. Report month-over-month change and year-over-year change separately because monthly variance is noisy.
KPI 4: Attributed Organic Revenue
What to measure: revenue from organic sessions to money pages, attributed via GA4 e-commerce tracking or GA4 conversion modelling for B2B sites without direct ecommerce. Why it matters: this is the test. Everything else is the chain leading here. If RDs grew, positions improved, sessions increased, but revenue did not, something else is wrong (conversion funnel, product fit, pricing).
Attribution is imperfect. Multi-touch attribution models assign partial credit; last-click models concentrate credit. Use a hybrid: last-click for transactional ecommerce, multi-touch for B2B sales cycles longer than 14 days. The full ROI math sits in the link building budget guide.
Which KPIs Do Not Belong in Client Reports?
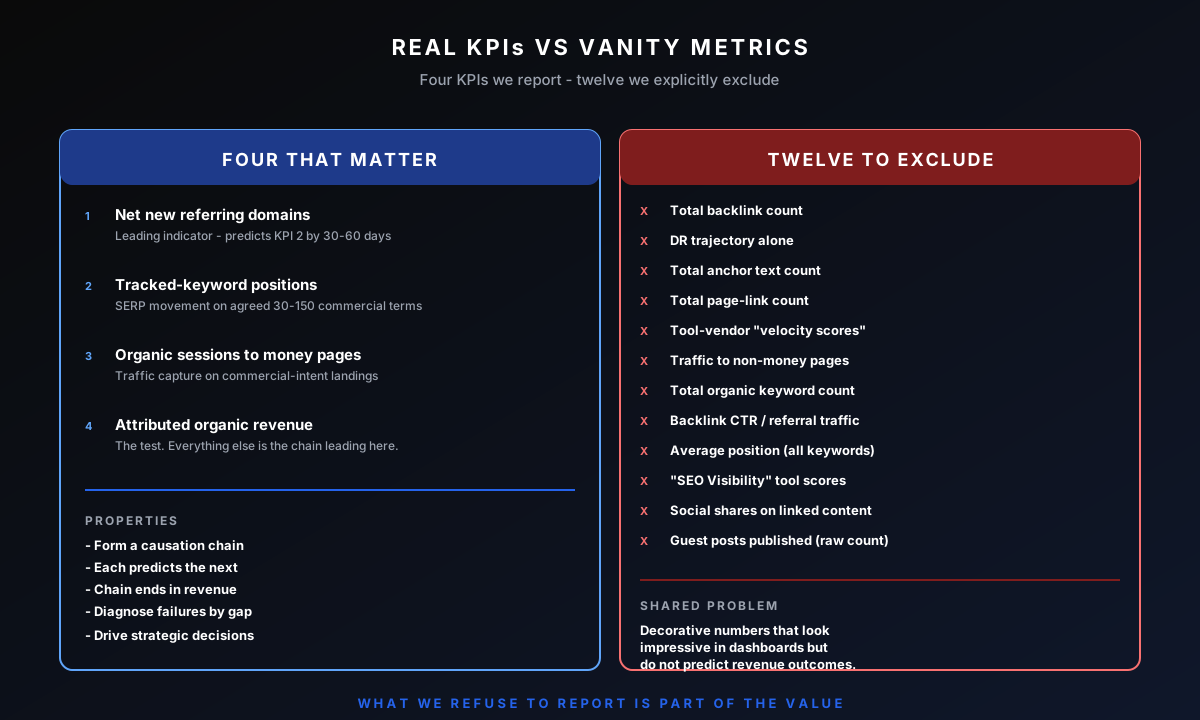
Twelve commonly-reported metrics that mislead clients into the wrong decisions.
Total Backlink Count
A site can gain 500 spammy backlinks in a month without gaining a single useful one. Reporting on backlink count rewards link volume regardless of source quality. New operators chase this metric and ruin campaigns.
Domain Rating (DR) Trajectory Alone
DR can climb without ranking improvement (PBN buildouts) or stay flat while rankings improve (acquired links are topically relevant but on smaller domains). DR is internal diagnostic data; reporting it suggests it predicts outcomes when it does not.
Total Anchor Text Count
Same problem as backlink count. Inflates with volume regardless of anchor quality.
Total Page-Link Count
Multiple inbound links from a single domain inflate the link count while passing diminishing additional ranking benefit. Reporting on page count obscures the referring-domain reality.
"link Velocity Score" from Tool Dashboards
Most tool-vendor velocity scores are decorative. They look impressive in dashboards but do not correlate with ranking outcomes in Mojo Links' data.
Traffic To Non-Money Pages
A blog post going from 200 to 2,000 monthly visitors looks great. If the post is informational and the visitors do not buy, the metric is vanity. Report on traffic to money pages only.
Total Organic Keyword Count
A site can rank for thousands of long-tail terms with no commercial intent. The keyword count grows; revenue does not move. Report on the curated tracked set, not the total.
Backlink CTR / Referral Traffic from Links
Most backlinks send minimal direct referral traffic. The SEO value sits in the ranking signal, not the click-through. Reporting referral traffic from links suggests the click-through matters when it usually does not.
Average Position Across All Ranking Keywords
Inflated by ranking #99 for thousands of long-tail terms that no one searches. Average position falls when you gain new low-ranking keywords; the metric punishes good growth.
Tool-Vendor "SEO Visibility" Scores
Each vendor calculates these differently. The numbers do not transfer between vendors and rarely correlate with revenue.
Social Shares on Linked Content
A linked article going viral on Reddit produces no ranking impact for the link recipient. Social and SEO are different attribution surfaces; mixing them in reports confuses causation.
Number of Guest Posts Published
Counts deliverables, not outcomes. Ten thin guest posts on low-DR sources beat zero on a vanity dashboard and lose to two good placements on the actual ranking score. Report acquired editorial backlinks by tier, not raw post count. Connects to the tactic taxonomy in the manual link building workflow.
How Do You Set Tracked-Keyword Sets Correctly?
Three rules govern the tracked set agreed at engagement start.
Commercial intent only. Tracked keywords must connect to revenue. Informational queries (research-phase searches) belong in content strategy reports, not link-building KPIs.
30 to 150 terms. Below 30, the dataset is too noisy to draw conclusions from. Above 150, the set tracks long-tail terms that dilute the signal.
Include both head terms and modifiers. Head terms (5-15 in the set) show difficulty-tier movement. Modifier terms ("best", "for small business", "vs competitor", location modifiers) show whether topical relevance is working.
How Frequently Should You Report on Link-Building KPIs?
Monthly for the four primary KPIs. Quarterly for deep-dive analysis (which sources moved the needle, anchor distribution health, profile composition vs baseline). Weekly for internal team review of tracked-keyword positions. Daily for nothing. Daily reporting on a system with 60-day lag windows produces noise, not signal.
How Did Mojo Links Develop This KPI Framework?
The four-KPI list was empirically reduced from a 17-metric framework we used in 2022-2023. We tracked which metrics, when shown to decision-makers, produced better strategic decisions versus worse ones. Twelve metrics produced no decision changes regardless of value or trajectory. The four remaining metrics consistently drove decisions that improved campaign outcomes. The 12-metric exclusion list above is the discard pile. This KPI chain is how we execute measurement, the seventh of the link building fundamentals every strategy needs.
Frequently Asked Questions About Link Building KPIs
Should We Report on Search Console Impressions and Clicks?
Yes, as a verification check on the four primary KPIs. GSC impressions and clicks confirm GA4 traffic figures. Include them in monthly reports as a secondary check, not a primary KPI.
What About Brand Search Volume?
Brand search volume is a side-effect indicator, not a link-building KPI. Track it for brands running concurrent PR or paid campaigns, but do not attribute brand-search growth to link building specifically.
How Do You Handle Reporting When Keyword Positions Oscillate?
Rolling 30-day average for tracked-keyword positions smooths most of the noise. Monthly reports compare current rolling average to previous month's rolling average, not raw daily snapshots.
These comparisons only mean something against the right horizon, because the link building timeline runs in months, not weeks.
Can You Measure Link-Building KPIs Without Ga4?
Partially. GSC alone covers impressions and clicks. RD count and position changes are tool-native. Revenue attribution requires either GA4, an alternative analytics platform, or manual conversion tracking. Without revenue attribution, the ROI test from KPI 4 is not possible.
How Long Should You Wait Before Changing Strategy Based on KPI Data?
Eight weeks minimum for RD growth signals. Twelve weeks minimum for position changes. Sixteen weeks minimum for revenue attribution. Changing strategy on smaller windows produces overcorrection.
Want Us To Set Up Your Link Building KPI Reporting?
KPI framework setup is part of every link building campaign kickoff. We define the tracked-keyword set, configure GA4 and Ahrefs reporting, and deliver the four-KPI monthly dashboard. Book a slot to discuss your reporting requirements.

About Bart Magera
Bart Magera is the founder of Mojo Links. Ten years across YMYL verticals (legal, medical, finance, supplements, crypto, gambling). Trained under Koray Tuğberk Gübür's Topical Authority framework. Author of two SEO books and international speaker.
Want this kind of analysis on your site?
Get a free video walkthrough within 48 hours covering technical health, backlinks, content gaps, and AI visibility.
Related posts
Keep reading on adjacent topics.
- Link Building
 Bart Magera10 min read
Contextual Backlinks: What They Are, Why They Win, and How To Earn Them
A contextual backlink sits inside the body of an article, surrounded by relevant text, not in a footer or author bio. That placement is what gives it weight. Here is what contextual backlinks are, what makes one high quality, how to earn them, and how to spot the cheap fakes.
- Link Building
 Bart Magera12 min read
What Is White Hat Link Building? Techniques That Work in 2026
The Problem: Why Most Link Building Fails Your SEO You wrote great content. It’s relevant. It’s useful. It even has infographics. But guess what? Crickets. Nobody’s linking. Google’s not ranking. And your “ultimate guide” is buried somewhere on page 7 under a recipe blog and a…
- Link Building
 Bart Magera10 min read
Tiered Link Building: How It Works and How To Do It Safely
Tiered link building layers weaker links behind your strongest ones to pass more authority to your money pages. Here is how the pyramid works, how to build one, which links are worth tiering, the risk SpamBrain introduced, and the lower-risk path I use on client sites.